Precision Agriculture: Opportunities in Canada for remote monitoring using open-source satellite imagery
![]()
IDEAWORKS fills the space between research and solutions by delivering customized support to organizations. We work side-by-side with startups, established companies and community organizations to address their challenges firsthand, often accessing government grants and leveraging industry-sponsored projects to make applied research opportunities possible.
This project was funded by the IDEAWORKS Catalyst Fund, which supports early-stage applied research at the college that can advance industry and business innovation.
Overview
Research Team: Soham Shah, Sharon Coyne (student), and Steven Decoster (student)
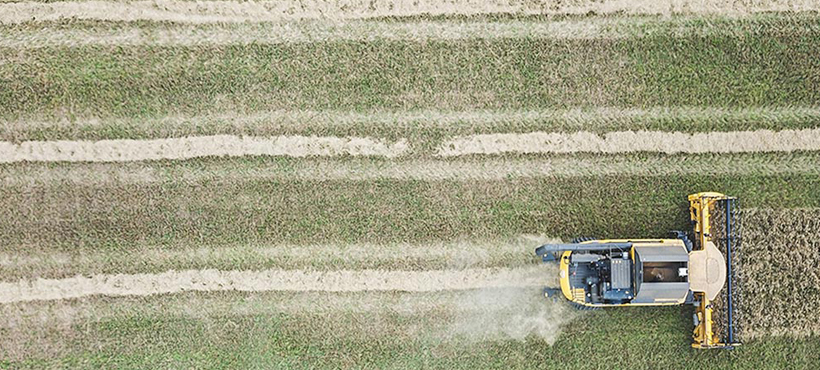
Early detection of crop health issues - such as crop infestations, poor crop appearance, or slow crop growth- is critical to ensuring good agricultural productivity on a farm. Precision agriculture is a rapidly growing method of agriculture that allows farmers to identify issues with their crops. Using remote data-gathering technologies such as UAVs/drones and paid satellites, farmers are able to acquire imagery that can help guide and optimize their farm management practices.
Many of these data-gathering technologies have high costs associated with using them, so a research team at Mohawk College explored whether the free open-source imagery from the Sentinel-2 mission satellites could provide accurate data that would allow for weekly crop health assessments at the field level.
Industry Challenge
In order to be effective for crop health monitoring, remote sensing imagery must be reviewed frequently (weekly at a minimum), must be delivered to the farmer quickly (usually within 2 days) and must be of high enough resolution to determine the quality of the crop.
Currently, the government of Canada publishes a weekly crop health metric using the Normalized Difference Vegetation Index (NDVI) calculated using the MODIS satellite imagery with a spatial resolution of 250m, meaning that one pixel represents a ground area of 250 by 250 meters. While useful for crop yield forecasting at regional and national levels, this spatial resolution is not sufficiently accurate to monitor crop health at the farm level. Capturing higher spatial resolution imagery requires a high-cost investment in private satellites, contract flights or UAVs.
Open-source proves promising
The recent availability of open-source optical images from the Sentinel-2 mission satellites represents an opportunity for farmers to monitor crop health using data that has a high spatial and temporal resolution at zero cost.
The research team found that while the monitoring of crop health was feasible using public domain satellite imagery from the satellite, it wasn’t perfect. While the resolution and quality of the images aided in determining a score using vegetation indices regular and consistent monitoring weren’t possible due to the interference of cloud cover.
However, forthcoming public domain satellite launches, such as Landsat 9 in 2021, have the potential to improve the quality of the open-source satellite imagery used for precision agriculture in the future.
Tools for Data Acquisition and Analysis
The data used in the research study was acquired and analyzed using remote sensing tools and methods, including the Sentinel 2 Explorer web GIS application for filtering and downloading the Sentinel 2 satellite imagery based on the day of the year and the cloud cover percentage, the NDVI and NDRE functions which were calculated to analyze the crop health and the correlation analysis conducted between the crop health index results and the actual weather data.
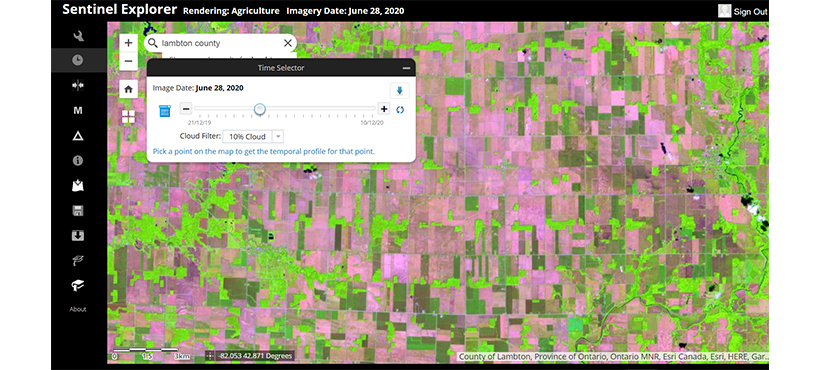
Sentinel 2 Satellite Imagery Explorer supported imagery analysis.
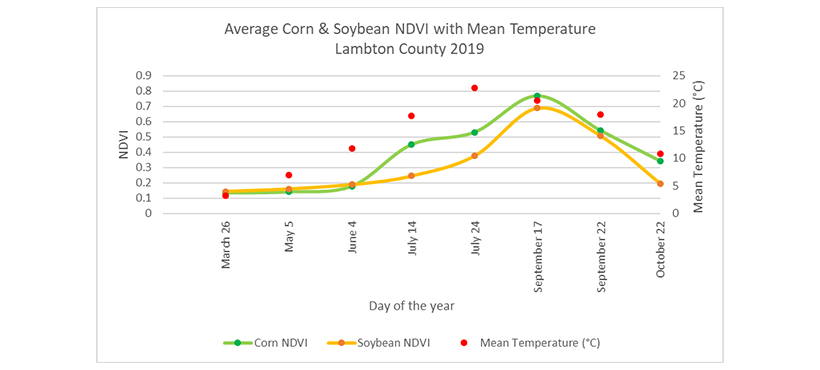
Sample NDVI and mean temperature data from Lambton County (Corn).
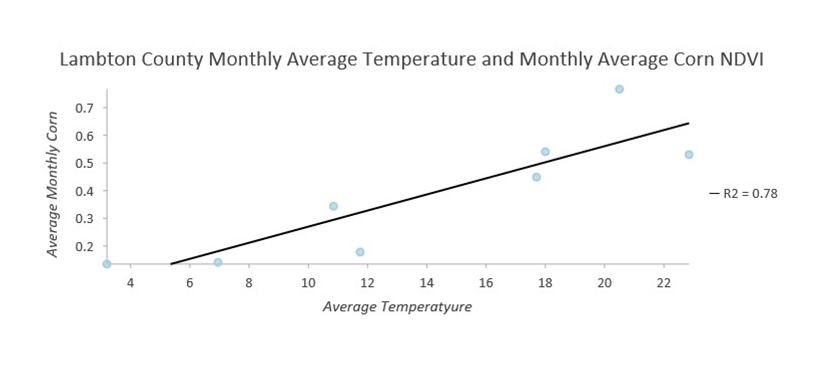
Correlation analysis for weather data and crop health index values.
